Main Features
As a result of Acosta Verde’s more than 30 years of experience in the development, operation, and management of community centers, the Sendero concept and brand was born in 2002 with the opening of Plaza Sendero Escobedo in the state of Nuevo Leon.
Since their inception, Sendero shopping centers have been known for their high occupancy and visitor traffic, even amid challenging times such as the financial crisis of 2008-2009.
Likewise, Sendero shopping centers stand out for offering a mixed concept of shopping and entertainment where retail stores and movie theaters act as anchors.
All of the above has allowed the company to become one of the leading retailers in Mexico, consolidating solid and lasting commercial relationships with the most recognized brands in the country.
Cornerstones of the Plaza Sendero Concept

Focus on Shopping Experience
- Highest quality facilities
- Ongoing events, activities, and promotions to drive visitor traffic
- Free Internet
- Loyalty plan to encourage recurring visits
- Sendero Day, which is a celebration held once a month
Tenant Composition
- Constant tracking of the latest market trends
- Behavioral analysis of the target population
- Offer adapted to the results of the two previous points to satisfy the entertainment, social, and shopping needs of visitors
Exclusive Location
- Presence in major and strategic cities
- Constant search for locations with attractive demographic profiles
- Located on main avenues, with high vehicle traffic, great visibility, and easy access for visitors
Retail Focus
- Essential business by satisfying consumer, convenience, entertainment, and service needs
- Target market is socioeconomic segments C and D+
- Location in metropolitan areas and strategic cities in Mexico where there is an under-penetration of community centers and with significant population growth
Physical
Characteristics
and Layout
- Average GLA of 35,000 m2 on approximately 15 hectares of land plot
-
Generally including the following:
- 1 supermarket
- 1 movie theater complex
- 4-5 department store
- 2-3 bank branches
- 2-4 stores (department stores, banks or restaurants) in stand-alone format in the parking area
- 4-6 stand-alone restaurants plus a food court
- ~100 stores for entertainment, clothing, footwear, electronics, gyms, among others
- Air-conditioned and covered spaces
- Essentially, each Sendero shopping center is a secure environment designed to meet the shopping and entertainment needs of Mexico’s middle and lower-middle income population
- Below is a diagram that roughly shows how the GLA is distributed at each Sendero shopping center.

Operational Strategy
- Proven model (layout and operation) where anchor stores and tenant composition are major drivers in shopping center performance
-
Strong focus on entertainment and leisure, including:
- Tenants with brands engaged in children’s and family entertainment as a fundamental component of the shopping center’s offering;
- Social events for all ages, concerts with famous artsts
- Increased business hours of gyms and fitness centers
- Sendero is a community gathering point
- During 2020, in the face of the lockdown measures, Sendero continued to innovate, introducing live broadcasting of a number of family events, allowing our customers to enjoy them from their homes and promote the Sendero brand;
- High occupancy rates since each opening, as ~50% of the GLA is leased to national chains, which have been with Acosta Verde in each new project.
- Use of social media to attract new clients and strengthen the loyalty of current clients through customized experiences
- Constant maintenance of the facilities, which allows the properties to operate efficiently
- Special focus on safety and security
Proven Results
- From their opening, they have high occupancy levels (target of at least 80% occupancy, without considering anchors), with predictable rents due to its long-term contracts.
- Generate a high visitor traffic (approximately more than 100 million per year; pre-COVID).
- High renewal rates.
Properties
At year-end 2020, Grupo Acosta Verde’s portfolio consisted of 18 properties, 16 in operation and 2 under development.
The Operating Portfolio is classified in 2 categories: i) the Stabilized Portfolio, comprised of shopping centers with an average age of 14.9 years, with high occupancy levels and stabilized revenue, where we also have eight sub-anchors acquired in 2017, whose premises are in some of the Stabilized Shopping centers. ii) Portfolio in Stabilization, made up of shopping centers opened as of 2016 (average age of 3.4 years at the end of 2020), which we believe have great growth potential
Regarding the Portfolio under Development, as of the date of this report, on March 11, 2021 the Sendero Santa Catarina shopping center opened, while the construction of Sendero Ensenada remains on hold due to the prevailing backdrop and its opening date is yet to be defined.
Moreover, we continue searching for new investment opportunities in the market, given our available resources, which we consider to be a competitive advantage. In this regard, we are continuously analyzing new investment opportunities to expand the portfolio and boost the Company’s profits. At the same time, we expect to raise brand awareness through the acquisition of new shopping centers and effective marketing strategy.
| Visitors | (millions) | |||||||
|---|---|---|---|---|---|---|---|---|
| Property | Portfolio | Opening | Main anchors | # of premises | 2020 |
2019 (1) | % AV (2) | AV’s co ownership share (3) |
| Sendero Escobedo | Stabilized | 2002 | Soriana, Cinépolis | 243 | 4.7 | 8.5 | 100.0% | 33.2% |
| Sendero Las Torres | Stabilized | 2003 | Soriana, Cinépolis | 192 | 5.9 | 13.7 | 100.0% | 49.7% |
| Sendero Periférico | Stabilized | 2004 | Soriana, Cinépolis | 222 | 8.2 | 11.7 | 100.0% | 31.8% |
| Sendero Ixtapaluca | Stabilized | 2005 | Soriana, Cinépolis | 188 | 3.8 | 6.7 | 100.0% | 45.5% |
| Sendero San Luis | Stabilized | 2006 | Soriana, Cinépolis | 186 | 4.7 | 8.0 | 100.0% | 47.8% |
| Sendero Toluca | Stabilized | 2006 | Soriana, Cinépolis | 210 | 5.1 | 8.7 | 100.0% | 48.4% |
| Sendero San Roque | Stabilized | 2006 | Soriana, Cinépolis | 123 | 3.8 | 4.7 | 100.0% | 20.6% |
| Sendero Juárez | Stabilized | 2008 | Soriana, Cinépolis | 201 | 3.3 | 6.5 | 100.0% | 52.9% |
| Sendero Apodaca | Stabilized | 2008 | Soriana, Cinépolis | 202 | 6.0 | 8.2 | 100.0% | 78.7% |
| F2715 | Stabilized | - | - | 8 | - | - | 50.0% | - |
| Sendero Chihuahua | In Stabilization | 2016 | Smart, Cinépolis | 164 | 1.9 | 4.3 | 56.9% | 100.0% |
| Sendero Los Mochis | In Stabilization | 2016 | Ley, Cinépolis | 190 | 2.8 | 4.7 | 56.9% | 100.0% |
| Sendero Tijuana | In Stabilization | 2016 | Ley, Cinépolis | 207 | 3.8 | 6.2 | 75.6% | 100.0% |
| Sendero Sur | In Stabilization | 2017 | Merco, Cinépolis | 219 | 3.5 | 5.0 | 75.6% | 100.0% |
| Sendero Obregón | In Stabilization | 2017 | Ley, Cinépolis | 169 | 2.1 | 3.4 | 75.6% | 100.0% |
| Sendero Culiacán | In Stabilization | 2018 | Ley, Cinépolis | 209 | 2.9 | 4.6 | 75.3% | 100.0% |
| Sendero Mexicali | In Stabilization | 2018 | Ley, Cinépolis | 201 | 2.8 | 4.1 | 100.0% | 100.0% |
| Sendero Santa Catarina | Under development | Marzo 2021 | Merco, Cinépolis | 225 | N/A | N/A | 40.0% | 100.0% |
| Sendero Ensenada | Under development | Por definir | Ley, Cinépolis | 178 | N/A | N/A | 100.0% | 100.0% |
(1) Pre-pandemic levels
(2) Percentage of total revenue and NOI generated by the GLA owned by Acosta Verde and
consolidated in the Company’s financial
statements
(3) Acosta Verde’s co-ownership share of each shopping center
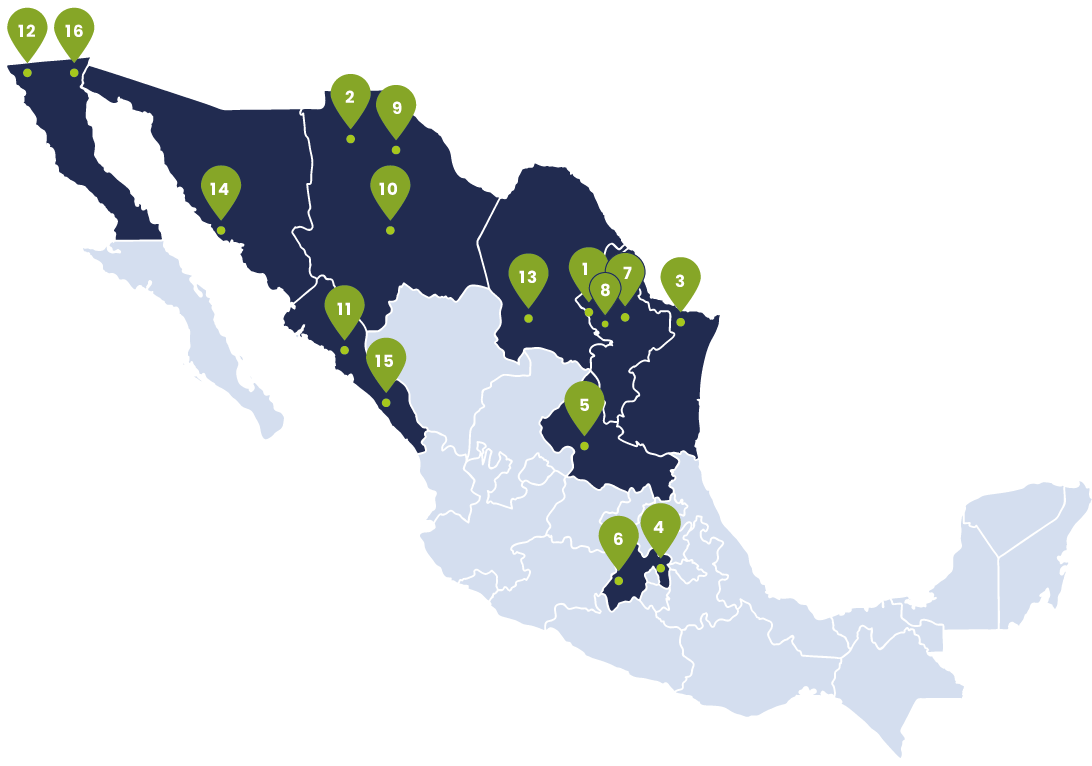
Geographic Footprint
Sendero shopping centers are in cities nearby and/or within industrial or service zones.
As of December 31, 2020, the 18 properties comprising Acosta Verde’s Consolidated Portfolio were distributed in nine states, mainly in the northeast and northwest region of Mexico.
| Point | Shopping Center | Location |
|---|---|---|
| 1 | Sendero Escobedo | Escobedo, Nuevo León |
| 2 | Sendero Las Torres | Ciudad Juárez, Chihuahua |
| 3 | Sendero Periférico | Reynosa, Tamaulipas |
| 4 | Sendero Ixtapaluca | Ixtapaluca, Estado de México |
| 5 | Sendero San Luis | San Luis Potosí, San Luis Potosí |
| 6 | Sendero Toluca | Lerma, Estado de México |
| 7 | Sendero San Roque | Juárez, Nuevo León |
| 8 | Sendero Apodaca | Apodaca, Nuevo León |
| 9 | Sendero Juárez | Ciudad Juárez, Chihuahua |
| 10 | Sendero Chihuahua | Chihuahua, Chihuahua |
| 11 | Sendero Los Mochis | Ahome, Sinaloa |
| 12 | Sendero Tijuana | Tijuana, Baja California |
| 13 | Sendero Sur | Saltillo, Coahuila |
| 14 | Sendero Obregón | Cajeme, Sonora |
| 15 | Sendero Culiacán | Culiacán, Sinaloa |
| 16 | Sendero Mexicali | Mexicali, Baja California |
| 17* | Sendero Santa Catarina | Santa Catarina, Nuevo León |
| 18* | Sendero Ensenada | Ensenada, Baja California |
*Properties under development as of December 31, 2020.
Main Tenants
One of Sendero’s core strengths, and Acosta Verde’s in general, are the strong and long-lasting relationships with its tenants, most of whom follow the Company in each project (up to 50% of the GLA of each new shopping center is pre-leased).
In this regard, the Sendero shopping centers are distinguished for opening with high occupancy rates, enabling the properties to achieve high visitor traffic and a diversified offer from day one. For this purpose, Acosta Verde has a robust nationwide sales force that is in constant communication with each tenant, to act ahead of their main growth initiatives.
At the same time, Acosta Verde’s sales force seeks to attract new tenants, who are closely followed up when they settle in one of the Company’s shopping centers, to anticipate service requests, thus seeking to ensure future lease renewals on favorable terms for both parties.
Thus, Acosta Verde’s tenant base is comprised of recurring tenants (who operate in more than 6 of the Company’s shopping centers) and new prospects from local, regional, or national chains.
Among our most prestigious commercial partners are Soriana, the second largest supermarket chain in the country, Cinépolis, the leading movie theater operator in Mexico, and Liverpool, the leading department store chain nationwide, integrating its Suburbia concept in some of Acosta Verde’s new developments.
Likewise, thanks to the constant pursuit of new commercial relationships with leading brands that strengthen the retail offer of each Sendero shopping center, brands such as Casa Ley (one of the leading supermarkets in the northwest region of Mexico), Merco, Smart, C&A, Happyland, Circus Park, SmartFit, Promoda, Miniso, Carl’s Jr, Starbucks, among others, have been incorporated.
It is important to mention that when the maturity date of the leases approaches, Acosta Verde’s renewal and retention team is in charge of the renewal negotiations, aiming to achieve the highest renewal rate possible and to increase the lease spread (indicator that reflects the variation between the average rent of a set of renewed leases against the previous average rent of such leases).
Our Tenants

Characteristics of the Lease Contracts
As of December 31, 2020, Acosta Verde held approximately 1,614 lease contracts, with a significant diversification by industry and location, which ensures the primary focus on satisfying the main consumption, convenience, and service needs of visitors.
In addition, the Company has around 280 leases in common areas, which contribute to the Company’s operating income.
| Tenant | # of leases |
GLA(m2) | % of total GLA |
|---|---|---|---|
| Cinépolis | 15 | 64,282 | 17.1% |
| Casa Ley | 5 | 33,686 | 9.0% |
| Suburbia | 3 | 19,029 | 5.1% |
| Coppel | 13 | 18,622 | 5.0% |
| Famsa | 6 | 13,666 | 3.6% |
| Woolworth | 6 | 11,551 | 3.1% |
| Promoda | 4 | 7,179 | 1.9% |
| Merco | 1 | 5,463 | 1.5% |
| Parisina | 8 | 5,411 | 1.4% |
| G-Mart | 1 | 4,906 | 1.3% |
| Total | 62 | 183,795 | 48.9% |
| Fixed Rent
Breakdown by Sector |
% Base Rent | % GLA |
|---|---|---|
| Food & Beverage | 15.9% | 9.9% |
| Entertainment | 15.8% | 22.0% |
| Clothing & Footwear | 14.1% | 10.7% |
| Department Stores | 13.3% | 21.5% |
| Specialty | 8.9% | 6.0% |
| Accessories | 5.6% | 2.2% |
| Telephony | 4.2% | 1.8% |
| Retail | 3.8% | 11.7% |
| Banks | 2.6% | 2.3% |
| Sports | 2.6% | 1.5% |
| Furniture | 1.7% | 2.6% |
| Others | 11.5% | 7.8% |
Key Operating Metrics
At the end of 2020, the operating portfolio consisted of 16 shopping centers, all developed and operated under the Community Center format that characterizes the Sendero brand, of which 9 are stabilized (170,261 m2) and 7 are in stabilization (237,334 m2).
Additionally, the stabilized portfolio includes eight sub-anchors acquired in 2017 through a trust (Trust identified as CIB 2715) whose premises are located at five Stabilized Shopping centers. The Company receives income from this trust, which is not consolidated in Acosta Verde’s financial statements and is recorded using the equity method (the Company’s stake is 50%).
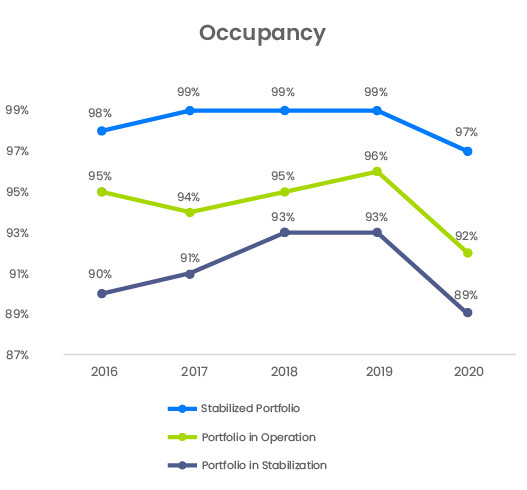
Occupancy of the Operating Portfolio
Operating portfolio occupancy decreased from 95.7% as of December 31, 2019 to 92.3% at year-end 2020, due to reductions of 2.3 pp. and 4.2 pp. recorded in the stabilized and stabilizing portfolios, respectively.
Despite the contraction in the occupancy rate of the operating portfolio, it is important to note that since the onset of the health contingency we have kept close contact and dialogue with our commercial partners (with whom we have long-lasting business relationships), which allowed us to mitigate the impact on the occupancy rate to only 3.4 pp. YoY.
| Property | GLA(m2) | Occupancy at year-end 2020 |
|---|---|---|
| Sendero Escobedo | 15,477 | 97% |
| Sendero Las Torres | 19,083 | 98% |
| Sendero Periférico | 13,962 | 98% |
| Sendero Ixtapaluca | 18,702 | 97% |
| Sendero San Luis | 17,773 | 96% |
| Sendero Toluca | 20,195 | 97% |
| Sendero San Roque | 6,026 | 92% |
| Sendero Juárez | 20,975 | 95% |
| Sendero Apodaca | 26,355 | 94% |
| F2715 Subanclas(1) | 11,713 | 100% |
| Total Stabilized | 170,261 | 97% |
| Sendero Chihuahua | 25,351 | 84% |
| Sendero Los Mochis | 34,441 | 89% |
| Sendero Tijuana | 39,203 | 98% |
| Sendero Sur | 36,897 | 84% |
| Sendero Obregón | 30,637 | 83% |
| Sendero Culiacán | 38,068 | 91% |
| Sendero Mexicali | 32,737 | 92% |
| Total in Stabilization | 237,334 | 89% |
| Total | 407,595 | 92% |
(1) Refers to 8 sub-anchor stores located in different Sendero shopping centers in Chihuahua, State of Mexico, Tamaulipas, and San Luis Potosi.
Visitor and Vehicle Traffic
Visitor traffic to Acosta Verde’s shopping centers decreased 40% YoY in 2020, attributable to the effects of COVID-19 outbreak, which prompted municipal, state, and federal authorities to implement different measures to encourage people to stay at home for most of the year.
Similarly, vehicle traffic in shopping center parking lots decreased 21.2% YoY, to 16.2 million vehicles from 21.3 million vehicles in 2019. The chart below shows the year-over-year comparison of vehicle traffic by quarter.
(millions of visitors)
(millions of vehicles)
Contract Maturities
The following table shows the maturities of existing contracts as of December 31, 2020, both in terms of GLA and fixed rent.
| Year | Number of contracts maturing |
GLA of maturing contracts (m2) |
% of GLA maturing |
Fixed rent maturing |
% of fixed rent maturing |
|---|---|---|---|---|---|
| 2021 | 661 | 76,619 | 20% | 24,899,172 | 31% |
| 2022 | 461 | 51,129 | 14% | 16,571,841 | 21% |
| 2023 | 305 | 60,114 | 16% | 13,919,257 | 17% |
| 2024 | 46 | 18,039 | 5% | 3,708,638 | 5% |
| 2025 | 22 | 6,711 | 2% | 1,509,032 | 2% |
| 2026 and onward | 119 | 163,031 | 43% | 19,112,752 | 24% |
It is noteworthy that most of the GLA matures after 2026.
Lease Renewal and Lease Spread
During 2020, 241 leases were renewed, equivalent to 22,084 m2 of GLA corresponding to the Operating Portfolio.
The Lease Spread for the year (indicator that reflects the variation between the average rent of a set of new leases compared to the average rent that matured in relation to the same set) was 3.5%, using as a basis for comparison the 25,385 m2 renewed and replaced during 2020.
Economic Contribution(1)
In line with operating results, the economic contribution of each of the properties comprising the operating portfolio declined on a year-over-year basis due to the impacts of the pandemic.
Below are the financial results of the portfolio on a cash flow basis as of December 31, 2020.
Revenue
The portfolio’s revenue corresponds to Fixed Rent, Variable Rent (% of sales), Common Areas (parking, advertising, common space rental) and Lease Fees.
Property Revenue
| Total Revenue (thousands of Mexican pesos) |
2019 | 2020 | Ch. % |
|---|---|---|---|
| Sendero Escobedo | 64,915 | 41,963 | (35.4%) |
| Sendero Las Torres | 79,456 | 55,755 | (29.8%) |
| Sendero Periférico | 45,587 | 42,670 | (6.4%) |
| Sendero Ixtapaluca | 78,890 | 50,375 | (36.1%) |
| Sendero San Luis | 89,879 | 65,131 | (27.5%) |
| Sendero Toluca | 105,941 | 68,246 | (35.6%) |
| Sendero San Roque | 10,466 | 4,188 | (60.0%) |
| Sendero Juárez | 53,336 | 34,878 | (34.6%) |
| Sendero Apodaca | 92,321 | 66,492 | (28.0%) |
| F2715 Subanclas(2) | 40,449 | 24,043 | (40.6%) |
| Stabilized Portfolio | 661,240 | 453,741 | (31.4%) |
| Sendero Chihuahua | 60,303 | 37,546 | (37.7%) |
| Sendero Los Mochis | 63,729 | 44,569 | (30.1%) |
| Sendero Tijuana | 93,999 | 75,469 | (19.7%) |
| Sendero Sur | 63,578 | 46,944 | (26.2%) |
| Sendero Obregón | 44,571 | 34,919 | (21.7%) |
| Sendero Culiacán | 76,124 | 52,824 | (30.6%) |
| Sendero Mexicali | 67,150 | 48,627 | (27.6%) |
| Portfolio in Stabilization | 469,454 | 340,898 | (27.4%) |
| Total | 1,130,694 | 794,638 | (29.7%) |
(1) Note: The information disclosed in the Economic Contribution subsection
considers the following
The information shown is on a cash flow basis and not on an accrual basis.
The information of the following shopping centers includes minority interests where Acosta
Verde has a stake: Chihuahua 56.9%, Los Mochis 56.9%, Tijuana
75.6%, Sur 75.6%, Obregon 75.6%, Culiacan 75.3%, and Mexicali 100%.
(2) Includes 100% of the revenue and or NOI from the CIB 2715 Trust, which are
not consolidated in Acosta Verde and are recorded by the equity method
(Acosta Verde’s stake is 50%).
Revenue Breakdown (Consolidated)
| Revenue Breakdown (thousands of Mexican pesos) |
2019 | 2020 | % Ch. |
|---|---|---|---|
| Fixed Rent | 941,874 | 690,815 | (26.7%) |
| Variable Rent | 83,378 | 34,810 | (58.3%) |
| Common Areas | 84,021 | 52,564 | (37.4%) |
| Lease Rights | 21,421 | 16,448 | (23.2%) |
| Total Revenue | 1,130,694 | 794,638 | (29.7%) |
NOI
| Total NOI (thousands of Mexican pesos) |
2019 | 2020 | % Ch. |
|---|---|---|---|
| Sendero Escobedo | 59,982 | 37,420 | (37.6%) |
| Sendero Las Torres | 74,989 | 51,544 | (31.3%) |
| Sendero Periférico | 43,025 | 40,525 | (5.8%) |
| Sendero Ixtapaluca | 73,714 | 45,913 | (37.7%) |
| Sendero San Luis | 84,583 | 60,172 | (28.9%) |
| Sendero Toluca | 99,485 | 62,662 | (37.0%) |
| Sendero San Roque | 7,077 | 1,482 | (79.1%) |
| Sendero Juárez | 47,181 | 29,583 | (37.3%) |
| Sendero Apodaca | 71,560 | 45,134 | (36.9%) |
| F2715 Subanclas(1) | 39,890 | 23,510 | (41.1%) |
| Stabilized Portfolio | 601,486 | 397,945 | (33.8%) |
| Sendero Chihuahua | 53,237 | 30,747 | (42.2%) |
| Sendero Los Mochis | 55,456 | 36,547 | (34.1%) |
| Sendero Tijuana | 85,960 | 68,910 | (19.8%) |
| Sendero Sur | 56,589 | 39,847 | (29.6%) |
| Sendero Obregón | 36,223 | 27,015 | (25.4%) |
| Sendero Culiacán | 65,372 | 43,829 | (33.0%) |
| Sendero Mexicali | 59,802 | 42,640 | (28.7%) |
| Portfolio in Stabilization | 412,639 | 289,535 | (29.8%) |
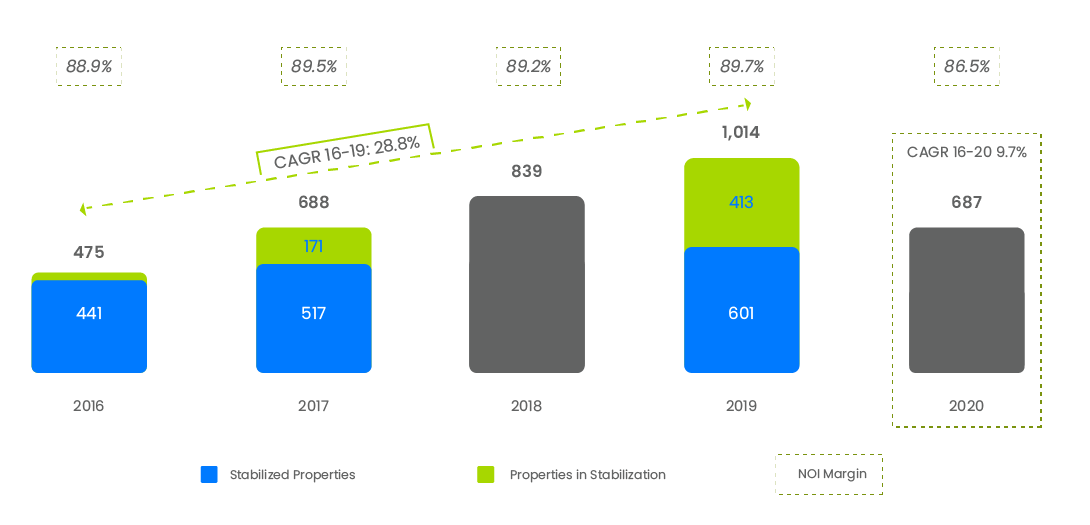
| Total | 1,014,125 | 687,478 | (32.2%) |
The following graph shows NOI evolution for 2016 - 2020 as well as NOI margin: